| Issue |
Eur. Phys. J. Appl. Phys.
Volume 97, 2022
Special issue on ‘Materials for Energy Harvesting, Conversion, Storage, Environmental Engineering and Sustainability’, edited by M. El Ganaoui, M. El Jouad, R. Bennacer and J.M. Nunzi
|
|
|---|---|---|
| Article Number | 66 | |
| Number of page(s) | 9 | |
| Section | Physics of Energy Transfer, Conversion and Storage | |
| DOI | https://doi.org/10.1051/epjap/2022220127 | |
| Published online | 26 September 2022 | |
https://doi.org/10.1051/epjap/2022220127
Regular Article
On the effect of concentration and wettability on polymer drops impact, dynamics and energy dissipation
1
International Centre in Fundamental and Engineering Thermophysics, Tianjin University of Commerce, Guangrong Rd 409, Beichen District, Tianjin 300134, P.R. China
2
Université Paris-Saclay, ENS Paris-Saclay, CNRS, LMT, 91190 Gif-sur-Yvette, France
3
Beihang Hangzhou Innovation Institute Yuhang, Xixi Octagon City, Yuhang District, Hangzhou 310023, P.R. China
4
School of Engineering, The University of Edinburgh, King's Buildings, James Clerk Maxwell Building, Peter Guthrie Tait Road, EH9 3FD Edinburgh, Scotland, UK
* e-mail: rachid.bennacer@ens-paris-saclay.fr
Received:
10
April
2022
Received in final form:
27
April
2022
Accepted:
17
May
2022
Published online: 26 September 2022
The present study aims to understand the influence of small quantities of poly-ethylene oxide (PEO) diluted in pure distilled water with concentrations of 50, 100 and 200 parts per million (ppm) in the impact phenomenon of drops onto substrates of Parafilm M, aluminium and glass. Both the static aspects (i.e., maximum spreading area) and the dynamic aspect (i.e., recoiling velocities), and different parameters of contact angle oscillations of the droplet are analysed. Results show that the maximum spreading diameter, dissipation mechanisms, and oscillations period all increase with the release height. Unlike contact angles oscillations envelope which gets thinner, oscillations length decreases with the increase of release height. Polymer concentration influences the maximum spreading base diameter of drops on non-hydrophobic substrates, i.e., higher concentration slows down recoiling velocities, reduces oscillations length, enhances dissipation mechanisms, and influences oscillations period as well. In addition, the wettability of substrates influences the spreading phase, drop rebound, and can damp recoiling of the polymer drops. A hydrophilic substrate reduces the oscillations length, increases their period and lessens their amplitude decay. The dependence of oscillations on the concentration illustrates a clear different behaviour on Aluminium surfaces (hydrophilic) and on Parafilm M surfaces (hydrophobic). The initial amplitude and the damping rate were analysed and related to the concentration.
© R. Bennacer et al, Published by EDP Sciences, 2022
 This is an Open Access article distributed under the terms of the Creative Commons Attribution License (https://creativecommons.org/licenses/by/4.0), which permits unrestricted use, distribution, and reproduction in any medium, provided the original work is properly cited.
1 Introduction
The effective wetting and control of evaporation time are among the most challenging problems in agricultural industry, since it is closely related to the public and environment protection [1–3]. Controlling the spreading and impact of droplets in spray applications in general is paramount. The development of chemical additives has led to more efficient spraying systems and therefore the usage of sprays such as in herbicides and pesticides is more streamlined, so as to fit with the rigorous toxicological regulations.
There are two possible scenarios at impact, in the case of a small impact velocity it can spread then recoil, however at higher impact velocity it can splash and form secondary droplets [3]. As for the morphology of leaves of most plants, the surfaces are characterized by an outer wax-like layer, which is a typical non-wetting substrate. In such circumstances, the sprayed droplets of herbicides or pesticides have the tendency to rebound, which consequently leads to a mass loss of more than 50% of the initial spray products [4].
The phenomenon of droplet rebound is a major problem not only in agriculture field, but also in various industrial applications. A number of studies have shown that the addition of very small quantity of a flexible polymer, for example PEO (Poly-Ethylene Oxide), can effectively inhibit the drop rebound on hydrophobic surfaces and modify the deposition pattern as well. The high elongational viscosity property restrains the droplets’ retraction after impact, which consequently prevents the rebound of droplets [5–7]. Moreover, the additives will not alter significantly the surface tension, the density, or shear viscosity of the fluid [8,9], yet it will change the fluid’s response to external force and render it viscoelastic [5]. Other researchers showed also that the proper use of dilute polymer solutions can simultaneously improve the product retention, droplet deposition, in addition to the spray characteristics, which involves a subtle balance between the molecular interaction and fluid hydrodynamics [6].
The hydrodynamics of droplet impact has been widely investigated experimentally, theoretically, and numerically [5,10–15]. Most studies focused on the earlier stage of rapid impact and spreading in order to quantify the maximum diameter that the impacting droplet could reach and to obtain the optimal deposition [13,16,17]. The study of Chen et al. shows that the addition of polymer chains could enhance interactions between the droplet and the surface, and also increase liquid viscoelasticity which, coupled with the hydrodynamics can affect the impinging droplet behaviour [18]. It is also found that on superhydrophobic surfaces, the presence of polymer does not influence droplet spreading yet restrains the droplet retraction and increases the contact duration of rebounding droplets. In addition, the elasticity of polymer chains enhances the restoring force during post impact droplet oscillations, and the induced non-Newtonian elongational viscosity could cause strong energy dissipation.
The diversity of studies on the dynamics of drops after impact on solid surfaces, as presented above, can be roughly divided into two stages, these are the spreading stage and the rebounding stage [18–21]. The former stage is characterized by drop impacting and spreading, during this stage the kinetic energy is converted into surface energy, while the latter stage features rebounding and oscillating, allowing for a cyclic conversion between surface and kinetic energies, and the total energy dissipates due to viscous losses.
Concerning numerical works, VOF (volume of fluid) method has been widely adopted in simulating droplet oscillation characteristics. Numerical studies on advancing/recoiling oscillation characteristics onto hydrophilic and hydrophobic surfaces were carried out by some researchers [22,23]. The quantified parameters include the average amplitude ratio, average oscillations period, and dimensionless wetting length. The results show that the impact velocity has a strong influence on the variations of the spreading factor, namely, with the increase of impact velocity, and the degree of droplet deformation increases. In addition, with the reduction of droplet size, surface and interface effects will dominate gradually the droplet behaviour.
Based on the current literatures, much attention has been drawn on post impact characteristics for Newtonian liquids, while investigations on non-Newtonian liquids are relatively limited and some studies do not agree on the effects of liquid spreading dynamics. For non-Newtonian droplets, the shear rate dependent viscosity gives rise to a complex phenomenon of spread-recoil dynamics [24].
In comparison to Newtonian fluids, which have the same surface tension and zero shear rate viscosity, a non-Newtonian polymer solution droplet could reach a higher maximum spreading diameter during recoil stage. The higher apparent viscosity polymer solution will therefore lead to slower recoil and damped shape oscillations.
For Newtonian fluids, the relevant dimensionless parameters that govern the impact and expansion stages, include Reynolds number (Re = ρuD/μ), Weber number (We = ρu2D/σ), and Capillary number (Ca = μu/σ). The involved parameters are the fluid density, ρ; the impact velocity, u; the droplet diameter or equivalent diameter, the dynamic viscosity μ, and the surface tension, σ.
In addition, wettability of substrates has to be considered in a non-dimensional representation, and other parameters such as surface roughness and the contact angle on substrates need to be considered in describing droplet impact as well. Another critical parameter concerns the viscoelastic of the polymer containing fluids. The viscoelastic behaviour of the polymer molecules features by a coiled state at rest for a minimum energy conformation, while converting into an unfolded state under certain hydrodynamic forces [25,26].
Unlike Newtonian incompressible fluid, for which the elongational viscosity is quantified as three times the shear viscosity [27], for a polymer solution, the ratio between elongational viscosity and shear viscosity (also known as Trouton’s ratio), can reach a much higher value [28]. Accordingly, the elongational viscosity is considered to be the major physical property for dilute polymer droplet to behave differently from droplets of pure solvent at a macroscopic level [7–9,29].
In the present study, we have considered non-Newtonian rheological effects, and focused on impacting drops’ oscillations and the dynamics of polymer dilute solution and its dependence on wettability. The adopted polymer solution is PEO diluted in pure distilled water. PEO is water soluble, highly hydrophilic, and it has the properties of water-retention, thickening, lubrication, etc. [30].
Three major parameters considered in this work are velocity of drop impact, PEO concentration and substrate characteristics (wettability). The different velocities of droplet impact is realized by different heights of drop release, and the three types of substrates with different wettability characteristics are glass, parafilm, and aluminium. The main objectives of the study include the droplets dissipation, oscillation parameters (amplitude, period, length), hydrodynamics behaviours, as well as droplet morphology during the impact process. We will present the experimental procedure and the obtained results. An analysis will demonstrate the complex behaviour induced by the polymer viscosity effect and the substrate exhibiting properties from hydrophobic to highly hydrophilic.
2 Experimental apparatus
The apparatus and setup used to conduct the experiments is represented in Figure 1. Single drops were created at the tip of a metallic needle (0.5 mm) by means of a screw-driven syringe dispenser. The needle was centred above the surfaces (either Parafilm, glass or aluminium) and held by a gradual arm which allowed adjusting the drop height with a precision of 0.05 mm. A transmissive photo-microsensor is located under the tip of the needle and triggered the camera when a single drop is released. The video acquisition system is equipped with an 18–108/2.5 zoom lens and horizontally aligned with the tested surface to record impacts of single drops. The high-speed camera (CMOS camera Phantom v4.0) operates at 1000 frames per second. Drop Shape Analysis DSA (Ver. 1.90.0.11) software analysed movies and calculated contact angles, as well as base diameter of every frames. Uncertainties in measurements of the contact angle and drop base radius are estimated at within ±1%. A lamp powered by a steady and continuous current provided back-to-front illumination. To ensure a fine optical alignment, the camera and the impacted surface and lighting system were fixed on an optical bench.
The 3 used substrates, are shown in Figure 2 together with the polymer solutions. The substrates selected, allowed to explore from hydrophobic (parafilm M) to highly hydrophilic (glass) wettability. The properties are summarized in Table 1.
Polyethylene oxide, PEO (4 × 10⁶ a.m.u) is a well-known polymer additive with high-molecular-weight and flexible chemical backbone. PEO powder added to water affects the properties of the solution (see Tab. 2) and in particular the value of elongational viscosity. Polymers in the solution stretch out as the fluid forms a filament [5] as illustrated in the insert of Figure 3. The polymer chain shapes are modified based on the local flow within the droplet and continuously change during the impact and the recoil.
The behaviour of droplets impacting substrates depends on many physicochemical parameters: fluid static proprieties (i.e., density ρ, shear viscosity ηs and elongational viscosity ηe, droplet diameter D0, liquid–vapour surface tension), substrate (solid–gas surface energy, solid–liquid surface tension, average surface roughness, wettability, dimensionless Capillary number Ca), dynamics of droplet (velocity, dimensionless Weber and Reynolds numbers We, Re). Note that for Newtonian fluids ηe = 3 ηs, and for non-Newtonian fluid ηe = T ηs with T known as the Trouton ratio.
The apparent viscosity of such solution is non-Newtonian and the apparent viscosity versus shear stress for such solution is represented in Figure 3 for two different concentrations. The non-Newtonian behaviour is explicit and confirms the Rheofluidifier (viscosity decreasing with shear stress when above a shear stress threshold) and we can see that the viscosity increases with the concentration. The viscosity exhibits a maximum for given shear rate with an increase below and decrease above.
 |
Fig. 1 Experimental setup. |
 |
Fig. 2 Substrate materials (Parafilm M, mirror-polish aluminium, glass) and chemical products (PEO powder, 50 ppm, 100 ppm, 200 ppm solutions). |
Physical properties of substrate materials.
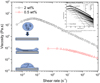 |
Fig. 3 Apparent viscosity with shear rate. The principal spreading shape of spreading drop and PEO filaments behaviour during impaction is given as insert. |
3 Experimental results and discussions
The temporal behaviour of the droplet impacting the substrate (as described in previous section) is analysed by following the drop base diameter and contact angle. An example of base diameter and contact angles is given in Figure 4 for a droplet of 50 ppm concentration falling from 8cm height on hydrophobic substrate (Parafilm M).
The temporal behaviour of the contact angle (left and right) and base diameter are illustrated in Figure 4. The temporal behaviour of the left and right contact angle of the droplet are calculated separately using the tangent method. The tangent method is applied on the recorded images as illustrated in the insert of Figure 4.
In an ideal case, when the droplet falls onto the substrate it will spread and recoil circularly. The sudden increase in diameter is followed by a decrease tending towards an equilibrium base diameter. This evolution is illustrated by the blue line (Fig. 4) and it seems that some oscillations appear as shown by the base diameter during this evolution. The corresponding contact angles are plotted in the same figure and there is clear oscillation around the final equilibrium contact angle. Hence the motion is supposed to be radial-independent. It worth noting that surface impurities or initial pending drop vibrations can affect behaviour. However, we observe almost the same oscillations and a deviation of less than 5° is observed. The test for reproducibility allows to confirm that between two drops of similar characteristics, there can be a slight phase shift (± 5 ms) and angle stabilisation value gap (± 5°). This can be caused by the various anchoring of the triple line on the substrate. Initial time (0 ms) is set when the drop has reached its maximum base diameter, after the spreading and before the recoiling. During the spreading phase, the advancing contact angles has a constant value. Moreover, oscillation measurements are very sensitive to noise, background light and computing errors.
We will analyse these oscillations by quantifying oscillations frequencies and provide remarks about dissipations mechanisms, and deducing amplitude decay (envelope fitting with exponential decay function).
The temporal behaviour of the droplet illustrated in Figure 5 illustrates a typical behaviour. This consists of impacting the surface, spreading and recoiling of the base diameter and symmetrical oscillations of contact angles (see discussion of Fig. 4). We will analyse mainly these frequencies and we will not attempt to analyse the possible inner waves appearing on the droplet surface, see Figure 5b, as this is beyond the scope of this study.
The graph below (Fig. 6) shows a comparison of obtained oscillations without (pure water) and with PEO concentration (solution of 200 ppm). The contact angle oscillates in a damping mode around the equilibrium steady contact angle (average value between left and right and noted as CAavg. The oscillating frequencies are determined using an FFT transform and are represented as an insert for the two liquids. The present case is on Aluminium substrate (Hydrophilic), the water drop oscillates with a frequency of almost 0.1 Hz and the solution with a more complex signal including a lower frequency of 0.05Hz, followed with two other frequencies at lower energy of 0.11 and 0.17 Hz, respectively.
In using PEO we previously highlighted the strong effect on viscosity when increasing concentration and also the fact of non-Newtonian behaviour (see Fig. 3). The increase of the release height (Re number values) increases inertia effect and modifies the internal drop velocity field (corresponding shear stress) inducing different paths of damping-dissipating towards the steady state (equilibrium state). The second important fact is that the hydrophilic substrate (Al) allows the energy to be distributed on a large base diameter. In such geometry, the velocity decreases as drop diameter increases. The graph summarising the effects of concentration and release height increase is given in Figure 7. The influence of PEO concentration on oscillations period value (inverse of frequency) shows an increase in period of the oscillations (decrease in frequency) for the different release heights until a maximum concentration (around 100 ppm). Moreover, high kinetic energy drops react more violently when they contain polymer and can double their period whereas low energy drops react by increasing their period by 200%. Above this value the period decreases or almost tends toward constant value for drop release height of more than 8 cm.
The previously discussed results i.e. hydrophilic case, show the complexity of coupling between the PEO concentration and effect on a variable viscosity depending on the resulting internal droplet flow. The observed oscillations illustrate such coupling between the maximum reached velocity imposed by the drop release height and the velocity decrease due to the spread and the substrate effect (contact angle). In case of a hydrophobic substrate, the drop spreading changes and the internal velocity field changes completely, so does the local shear stress and apparent viscosity. The contact angle (CA, deviation to the average static contact angle) evolution versus time on Parafilm M (hydrophobic) and the corresponding FFT are represented in Figure 8. The presented results are for two release heights (2 and 4 cm) and PEO concentration of 50 ppm. For the two presented heights the oscillations and the corresponding frequencies are almost equal (0.087) for the concentration of 50 ppm. This clearly illustrates substrate wettability effect as it will change completely the dynamic and the internal flow and corresponding damping rate caused by the apparent viscosity.
On such hydrophobic surface as Parafilm M, it shows firstly that the presence of PEO prevents rebound. All pure water drops are rebounding on Parafilm M except the one released from 2 cm height. Secondly, the increase of PEO concentration reduces drop contact angles oscillations period.
The energy dissipation mechanisms are enhanced by the presence of PEO in the droplet. Increasing the polymer concentration allowed creating inner rings (f ∼ 0.2) for lower heights and dissipating more efficiently the kinetic energy of impact.
In order to summarise the effects of concentration and height, Figure 9 is presented. Such graph shows the influence of PEO concentration on oscillations period value (inverse of frequency). The observed period of the oscillations (frequency) shows a relative decrease with the increase of concentration for different release heights until a threshold concentration (around 100 ppm). The period is almost constant or slightly increase above this value except for lower kinetic energy cases. In comparison with the hydrophilic substrate, the impact is less violent for this hydrophobic case, due to the presence of the polymer additive and their period changes by less than 20% for the worst situation (2cm) and less than 9% for all other investigated cases.
For each drop, the period of oscillation is constant during the whole sequence. The trend is that the more kinetic energy the drop has, the longer the oscillations will be for concentration above 100 ppm. The maximum CA amplitude oscillation is certainly determined by the PEO concentration, the substrate type and the release height. We will discuss such effects in the following sections.
The previously represented CA oscillations (Figs. 4, 6 and 8) can be explored through the analysis of oscillations frequency and the signal envelope with the initial amplitude and a damping parameter. Therefore, the oscillations can be represented by the expression below, with an initial amplitude A0, damping function with coefficient and oscillatory mode of frequency f.

To illustrate the initial amplitude and the damping rate, we plot the envelope of different signals in Figure 10a. The plotted envelopes are for different concentrations and illustrate again the complex coupling. With the increase of PEO concentration, both amplitude and damping change. An identification fitting is used in order to get the envelope characteristics (A0, f) and plotted in Figure 10b. We observe clearly a decrease of the amplitude with the increase of concentration and the damping increase suddenly around 100 ppm concentration (from 8 × 10⁻³ to 2 × 10⁻²). As part of the damping is due to the viscous dissipation effect, it is obvious that the inner flow (liquid velocity) can be related to the angle oscillating velocity, expressed as  ∼ A0σ. We plot this coefficient as an insert in Figure 10b. This product seems to remain constant and changes during the transition stage where the PEO concentration effect is acting and before reaching a saturating effect.
In this problem we have an initial impact velocity resulting from the initial release height (described by a Re number), and followed by the droplet spreading. Such spreading is controlled by the contact angle (wettability so tendency towards equilibrium), by the viscosity (dissipation), surface tension and inertia acting as memory. For the used fluid, the viscosity (dissipation) is directly related to the shear stress level (velocity gradient) and also the local fluid state (history).
The oscillatory amplitude will be controlled by the initial impact velocity (height) as it contributes to the spreading and the contact angle defining the equilibrium (minimisation). During a dynamic behaviour the surface tension will be an acting force. The viscosity is a resistance action against the motion in both spreading and receding. Moreover, the local velocity and its spatial distribution affects the apparent local viscosity (continuously changing). Such changes in the viscosity will induce a non-symmetrical behaviour in damping (dissipative system), which is the possible oscillatory flow.
These different physical phenomena are summarised in Figure 11. This figure illustrates the initial release height and consequently dictates the initial Re magnitude. At the beginning of the spreading, the surface tension and the contact angle tend to drag the system towards the equilibrium state (positive action towards minimisation). The induced flow and inertia drive the droplet flow over the equilibrium position and both the surface tension and contact angle became resistant against the motion. The viscosity acts continuously as a dissipative factor above and below the equilibrium position. The oscillatory motion exhibits a supplementary non-linearity due to the non-Newtonian behaviour (viscosity is function of local shear stress and concentration). The mechanisms described above can be used to propose an analogy with a resistive-dissipative diagram as shown in Figure 11. Such viscous phenomena can be represented by a classical resistant-dissipative block [24] for which we did not integrate the possible thixotropy [25], as this is beyond the scope of this study. The challenges will be to write the equivalent simplified model (differential equation) integrating the different underling physics involved and solve it analytically. Such approach will allow to find the conditions of oscillating modes for different rheology (viscosity vs. concentration). This work will constitute an interesting perspective.
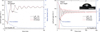 |
Fig. 4 Contact angles (CA) and base diameter (BD) evolution versus time. |
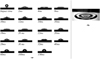 |
Fig. 5 Droplet (200 ppm) shape evolution on Parafilm M, the spreading and the recoiling a) and the surface waves b), for drop released from a height of 5 cm. |
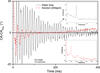 |
Fig. 6 Contact angle (CA) deviation to the average static contact angle evolution versus time on Aluminium and the corresponding FFT for two concentrations (0 ppm `Water' and the 200 ppm with = 83.6° and 22.2° respectively). |
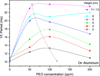 |
Fig. 7 The effect of PEO concentration on the frequencies of angle oscillations of drops impacting Aluminium substrate, for different release heights. |
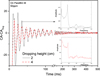 |
Fig. 8 Contact angle (CA) deviation to the average static contact angle evolution versus time on the Parafilm M and the corresponding FFT for two release height (2 and 4 cm with =91.5° and 93.1° respectively), for 50 ppm. |
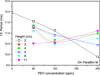 |
Fig. 9 The effect of the PEO concentration on the frequencies of contact angle oscillations on Parafilm M, for different release heights. |
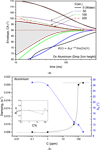 |
Fig. 10 Effect of concentration on the envelope of oscillating CA signal a) and the corresponding damping and initial amplitude, 2 cm release height on Aluminium b). |
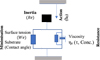 |
Fig. 11 Schematic diagram summarising the physical phenomenon involved in the present problem, the viscosity resistance is represented by the classical viscosity changes. |
4 Conclusion
The objective of this work was to understand the influence of poly-ethylene oxide (PEO) concentration in water during the impact of droplets onto hydrophilic and hydrophobic substrates (Parafilm M, aluminium and glass). Both static aspects (such as maximum wettable diameter and steady base diameter), and dynamic behaviour (such as recoiling velocities, and different parameters of contact angle oscillations of the droplet) were analysed.
We showed the link between the CA oscillation frequencies and external factors such as the substrate, PEO concentration and imposed kinetic energy i.e. release height. The initial CA amplitude and damping rate of the system were analysed to illustrate the complexity of the problem. We showed how the non-Newtonian viscosity behaviour is strongly related to the other parameters.
Results also show that the maximum spreading diameter, dissipation mechanisms, and oscillations period all increase with the drop release height, unlike contact angles oscillations envelope which get thinner, and oscillations duration decreases with the release height.
Polymer concentration influences the maximum spreading base diameter of high energy drops on non-hydrophobic substrates. It slows down recoiling velocities, reduces oscillations length, helps dissipation mechanisms, and influences oscillations period. In addition, the wettability of substrates influences the spreading phase, drop rebound, and can damp recoiling of polymer drops. Hydrophilic substrate reduces the oscillations duration, increases their period and lessens their amplitude decay.
The mechanisms identified and described allows the analogy with a resistive-dissipative diagram and this will be the scope of future work. Such approach will allow to find the conditions of oscillating modes for different rheology (viscosity vs. concentration). The proposed equivalent model will allow to get access to a prediction either by a direct simulation or if any analytical solution for specifical situation.
Nomenclature
f: Oscillatory mode of frequency
Dimensionless Number
Abbreviation
Part of this project received funding from the European Union’s Horizon 2020 research and innovation programme under the Marie Skłodowska-Curie grant agreement No. 778104.
Author contribution statement
Rachid BENNACER analysed the data and led the write-up of the paper. Xiaoyan MA contributed to the write-up. Khellil SEFIANE supervised the experiments.
References
- Y. Yu, H. Zhu, J.M. Frantz, M.E. Reding, K.C. Chan, H.E. Ozkan, Biosyst. Eng. 104, 324 (2009) [CrossRef] [Google Scholar]
- L.A. Xu, Biosyst. Eng. 106, 58 (2010) [CrossRef] [Google Scholar]
- S. Sikalo, M. Marengo, C. Tropea, E.N. Ganic, Exp. Therm Fluid Sci. 2, 347 (2016) [Google Scholar]
- W. Wirth, S. Storp, W. Jacobsen, Pestic. Sci. 33, 411 (1991) [CrossRef] [Google Scholar]
- V. Bertola, K. Sefiane, M. Road, Engineering 20 (2005) [Google Scholar]
- V. Bergeron, Comptes Rendus Phys. 4, 211 (2003) [CrossRef] [Google Scholar]
- V. Bergeron, D. Bonn, J.Y. Martin, L. Vovelle, Nature 405, 772 (2000) [CrossRef] [PubMed] [Google Scholar]
- R.P. Mun, B.W. Young, D.V. Boger, J. Nonnewton. Fluid Mech. 83, 163 (1999) [CrossRef] [Google Scholar]
- R. Crooks, J. Cooper-White, D.V. Boger, Chem. Eng. Sci. 56, 5575 (2001) [CrossRef] [Google Scholar]
- T. Mao, D.C.S. Kuhn, H. Tran, AIChE J. 43, 2169 (1997) [CrossRef] [Google Scholar]
- X. Zhang, O.A. Basaran, J. Colloid Interface Sci. 187, 166 (1997) [CrossRef] [Google Scholar]
- M. Pasandideh-Fard, Y.M. Qiao, S. Chandra, J. Mostaghimi, Phys. Fluids 8, 650 (1996) [CrossRef] [Google Scholar]
- S. Chandra, C.T. Avedisian, Proc. R. Soc. London, Ser. A 432, 13 (1991) [CrossRef] [Google Scholar]
- J. Fukai, Z. Zhao, D. Poulikakos, C.M. Megaridis, O. Miyatake, Phys. Fluids A 5, 2588 (1993) [CrossRef] [Google Scholar]
- M. Bussmann, J. Mostaghimi, S. Chandra, Phys. Fluids 11, 1406 (1999) [CrossRef] [Google Scholar]
- T. Bennett, D. Poulikakos, J. Mater. Sci. 28, 963 (1993) [CrossRef] [Google Scholar]
- B.L. Scheller, D.W. Bousfield, AIChE J. 41, 1357 (1995) [CrossRef] [Google Scholar]
- L. Chen, Y. Wang, X. Peng, Q. Zhu, K. Zhang, Macromolecules 51, 7817 (2018) [CrossRef] [Google Scholar]
- D. Banks, C. Ajawara, R. Sanchez, H. Surti, G. Aguilar, At. Sprays 24, 895 (2014) [CrossRef] [Google Scholar]
- D. Zang, X. Wang, X. Geng, Y. Zhang, Y. Chen, Soft Matter 9, 394 (2013) [CrossRef] [Google Scholar]
- X. Tang et al., Int. J. Heat Mass Transfer 183, 859 (2022) [Google Scholar]
- Z. Yin et al., Microgravity Sci. Technol. 33, 1 (2021) [CrossRef] [Google Scholar]
- Y. Yao, S. Meng, C. Li, X. Chen, R. Yang, in ASME 2016 International Mechanical Engineering Congress and Exposition (2016) [Google Scholar]
- V. Ravi, M.A. Jog, R.M. Manglik, Post-Impact Spread-Recoil Behavior of Non-Newtonian Liquid Droplets Thermal-Fluids and Thermal Processing Laboratory University of Cincinnati Cincinnati, OH 45221-0072 USA, Processing, no. May, 2011. [Google Scholar]
- P.G. De Gennes, J. Chem. Phys. 60, 5030 (1974) [CrossRef] [Google Scholar]
- A. Keller, J.A. Odell, Colloid Polym. Sci. 263, 181 (1985) [CrossRef] [Google Scholar]
- R.B. Bird, C.F. Curtiss, R.C. Armstrong, O. Hassager, Dynamics of Polymeric Liquids, Volume 2: Kinetic Theory, 2nd edn. (Wiley, New York, 1987) [Google Scholar]
- G.G. Fuller, C.A. Cathey, B. Hubbard, B.E. Zebrowski, J. Rheol. (N.Y.N. Y). 31, 235 (1987) [CrossRef] [Google Scholar]
- R. Crooks, D.V. Boger, J. Rheol. (N.Y.N. Y). 44, 973 (2000) [CrossRef] [Google Scholar]
- S. Dhawan, K. Dhawan, M. Varma, V.R. Sinha, Pharm. Technol. 29, 82 (2005) [Google Scholar]
Cite this article as: Rachid Bennacer, Xiaoyan Ma, Khellil Sefiane, On the effect of concentration and wettability on polymer drops impact, dynamics and energy dissipation, Eur. Phys. J. Appl. Phys. 97, 66 (2022)
All Tables
All Figures
|
Fig. 1 Experimental setup. |
| In the text | |
|
Fig. 2 Substrate materials (Parafilm M, mirror-polish aluminium, glass) and chemical products (PEO powder, 50 ppm, 100 ppm, 200 ppm solutions). |
| In the text | |
|
Fig. 3 Apparent viscosity with shear rate. The principal spreading shape of spreading drop and PEO filaments behaviour during impaction is given as insert. |
| In the text | |
|
Fig. 4 Contact angles (CA) and base diameter (BD) evolution versus time. |
| In the text | |
|
Fig. 5 Droplet (200 ppm) shape evolution on Parafilm M, the spreading and the recoiling a) and the surface waves b), for drop released from a height of 5 cm. |
| In the text | |
|
Fig. 6 Contact angle (CA) deviation to the average static contact angle evolution versus time on Aluminium and the corresponding FFT for two concentrations (0 ppm `Water' and the 200 ppm with = 83.6° and 22.2° respectively). |
| In the text | |
|
Fig. 7 The effect of PEO concentration on the frequencies of angle oscillations of drops impacting Aluminium substrate, for different release heights. |
| In the text | |
|
Fig. 8 Contact angle (CA) deviation to the average static contact angle evolution versus time on the Parafilm M and the corresponding FFT for two release height (2 and 4 cm with =91.5° and 93.1° respectively), for 50 ppm. |
| In the text | |
|
Fig. 9 The effect of the PEO concentration on the frequencies of contact angle oscillations on Parafilm M, for different release heights. |
| In the text | |
|
Fig. 10 Effect of concentration on the envelope of oscillating CA signal a) and the corresponding damping and initial amplitude, 2 cm release height on Aluminium b). |
| In the text | |
|
Fig. 11 Schematic diagram summarising the physical phenomenon involved in the present problem, the viscosity resistance is represented by the classical viscosity changes. |
| In the text | |
Current usage metrics show cumulative count of Article Views (full-text article views including HTML views, PDF and ePub downloads, according to the available data) and Abstracts Views on Vision4Press platform.
Data correspond to usage on the plateform after 2015. The current usage metrics is available 48-96 hours after online publication and is updated daily on week days.
Initial download of the metrics may take a while.