| Issue |
Eur. Phys. J. Appl. Phys.
Volume 90, Number 2, May 2020
|
|
|---|---|---|
| Article Number | 20103 | |
| Number of page(s) | 8 | |
| Section | Semiconductors and Devices | |
| DOI | https://doi.org/10.1051/epjap/2020200063 | |
| Published online | 01 July 2020 | |
https://doi.org/10.1051/epjap/2020200063
Regular Article
Hybrid nanophotonic-nanomagnonic SiC-YiG quantum sensor: II/dark spins quantum sensing with V2 spins and fiber based OP-PELDOR/ODMR
Institut de Chimie de Strasbourg, Strasbourg University, UMR 7177 (CNRS-UDS),
4 rue Blaise Pascal, CS 90032,
67081
Strasbourg Cedex, France
* e-mail: This email address is being protected from spambots. You need JavaScript enabled to view it.
Received:
2
January
2020
Received in final form:
12
May
2020
Accepted:
26
May
2020
Published online: 1 July 2020
Abstract
First experiments like optically detected (OD) electron paramagnetic resonance (ODMR), photoluminescence detected RABI oscillations, and optical pumping (OP) assisted pulsed EPR measurements of T2 and T1 of V2 spins in bulk SiC, which were previously demonstrated on various home build EPR spectrometers with free space optics, are here all demonstrated for the first time using a commercial X band pulsed EPR spectrometer combined with a single optical fiber and a standard external photoluminescence setup. Quantum sensing of bulk dark spins dipolar coupled to V2 spins in SiC is also demonstrated here for the first time using single fiber based OP assisted pulsed electron electron double resonance spectroscopy (PELDOR). A spin wave resonance study of model permalloy nanostripes is also presented allowing to check the ferromagnetic nanostripes design. These experiments are first key steps towards the fiber-based integration of the recently proposed SiC-YiG quantum sensor device [J. Tribollet, Eur. Phys. J. Appl. Phys. 90, 20102 (2020)], to a commercially available and worldwide used pulsed EPR spectrometer, with important applications expected in structural biology, surface chemistry, and quantum computing.
© J. Tribollet, EDP Sciences, 2020
 This is an Open Access article distributed under the terms of the Creative Commons Attribution License (http://creativecommons.org/licenses/by/4.0), which permits unrestricted use, distribution, and reproduction in any medium, provided the original work is properly cited.
1 Introduction
I recently presented the theory [1] of a new SiC-YiG quantum sensor and the associated state of art optically detected pulsed double electron electron spin resonance spectroscopy (OD-PELDOR), allowing sub-nanoscale single external spin sensing. This new methodology requires only the use of a standard X band pulsed EPR spectrometer [2], as well as an optical fiber and a new SiC-YiG quantum sensor [1], in which a single V2 silicon vacancy color center in 4H-SiC [3–7] is used as the spin probe. The single optical fiber and the quantum sensor can be both introduced in a standard EPR tube, thus requiring a minimal experimental development [1] around the commercial cw/pulsed EPR spectrometer widely used worldwide. This pulsed EPR spectrometer was developed by microwave engineers over decades and is still under development nowdays. It already allows a wide set of possible experiments [2] including pulsed EPR, pulsed ELDOR, pulsed ENDOR (electron nuclear double resonance) experiments, all at X band (around at 10 GHz), on both solid and liquid paramagnetic samples, and at a temperature comprised between 4 K and 300 K. Adding the capability of single external spin quantum sensing with sub-nanoscale resolution to this nice commercial pulsed EPR spectrometer would constitute a very nice opportunity of upgrade of this spectrometer for the large community of chemists, biologists and physicists, which are already pulsed EPR users worldwide.
Many properties of the V2 color centers in 4H-SiC are already known since few years [3–7], including spin relaxation and decoherence time, optical pumping behavior, and photoluminescence properties. A very recent review [8] has collected many of the known optical and spin properties of all known color centers in the SiC material and has listed some of their potential quantum applications (see also the many references inside this review). On the experimental side, it must be underlined that the paramagnetic properties of the SiC color centers, and in particular those of the V2 color centers, have been already investigated by various magnetic resonance methods. They were investigated for example by standard inductively detected continuous wave EPR spectroscopy combined with free space optical pumping using a commercially available EPR spectrometer [9], or by sensitive photoluminescence detected Zero Field magnetic resonance spectroscopy (ZF-ODMR) [10], or by optically detected and optical pumping assisted pulsed magnetic resonance spectroscopy (pulsed OP-OD-MR) using home built pulsed EPR spectrometers combined with free space light pulse excitation and photoluminescence collection. Some of those advanced pulsed OP-OD-MR experiments were performed over spin ensemble [11] using far field free space excitation and collection of photoluminescence. Other advanced pulsed OP-OD-MR experiments, using efficient and spatially selective photoluminescence collection by confocal microscopy, eventually further improved by a solid immersion lens (SIL) designed in the SiC material (allowing to achieve a much higher sensitivity), were performed over a single color center in SiC [4,12,13].
Some continuous wave fiber bundle based ODMR experiment (exciting and detecting photoluminescence by different fiber path) have been performed few years ago on other materials [14]. However, to the best of my knowledge, single optical fiber based pulsed OP/OD-MR experiments were never performed on 4H-SiC color centers using a standard commercial pulsed EPR X band spectrometer combined with an external setup for photoluminescence excitation and collection through a single optical fiber (using a dichroic mirror to distinguish the excitation path from the collection path). Here, I demonstrate this, which is a first important experimental step towards the future integration of the proposed new SiC-YiG quantum sensor to an optical fiber inside a 3D microwave resonator. Integrating an optical fiber, an optical coupler and the SiC device inside a standard EPR tube, itself inserted inside the standard 3D microwave resonator of the worldwide used commercial pulsed EPR spectrometer is, in a sense, equivalent to introducing part of the optical setup inside the 3D microwave resonator. As it was theoretically demonstrated previously [1], the use of the proposed nanophotonic-nanomagnonic SiC-YiG quantum device will further allow to achieve spatially selective and highly efficient collection of the photoluminescence of the single color center in SiC, because the exciting light pulse and the photoluminescence photons will be efficiently waveguided on the nanophotonic SiC chip proposed, between the optical fiber and the V2 color center spin probe [1]. This is the opposite approach to previous ones with single color center sensitivity [4,12,13], where, in a sense, the home built pulsed EPR spectrometer, in the form of a flat microwave chip device, was introduced inside the optical confocal microscope, at the price of building a homemade pulsed EPR spectrometer compatible with the optical confocal microscope, with the appropriate cryogenic and software environment, all requiring lots of time, money and appropriate engineering skills, if one wishes to reach the capabilities offered by modern state of art pulsed EPR spectrometers.
Also, some recent work investigated magnetic field and temperature sensing with color centers in SiC [3]. However, to the best of my knowledge, dark spin quantum sensing by dipolar couplings to V2 color centers in 4H SiC has never been demonstrated to date using fiber based optical pumping assisted PELDOR experiments at X band. Here I demonstratethis, using a commercial pulsed EPR/pulsed ELDOR X band spectrometer and an optical fiber. This is a second key experiment towards the development of the new SiC-YiG quantum sensor and its related nanoscale ultra-sensitive ODPELDOR methodology, because PELDOR spectroscopy at two different microwave frequencies and single fiber based optical pumping are two key experimental tools to combine in this new proposed methodology [1].
The whole experimental setup I used corresponds to the one described in Figure 2 of my previous theoretical work [1], the coupler between the SiC sample and the optical fiber being here a GRIN microlens. The optical fiber, the GRIN microlens and the bulk HPSI 4H-SiC sample containing residual V2 spins are all introduced in an EPR tube, which itself is inserted inside the pulsed EPR/ELDOR resonator, a flexline resonator from Bruker (MD5 or MS3 depending on experiments). The pulsed EPR resonator itself is introduced inside an Oxford CF935 continuous flow cryostat for pulsed EPR spectroscopy at variable temperature (4–300 K). When necessary, a 785 nm laser was used for optical pumping of V2 spins and for optical excitation of the V2 color center photoluminescence, centered at around 915 nm at low temperature. This photoluminescence was detected, after optical filtering, by a silicon photodiode, in all presented ODMR experiments. Excitation and collection of the photoluminescence of the SiC sample was performed using the same optical fiber by means of a dichroic mirror, distinguishing the excitation and the collection path of the photoluminescence. A lock in amplifier or a transient recorder were used for data acquisition, which were visualized on the XEPR software of Bruker provided with the ELEXYS E580 pulsed EPR spectrometer.
Finally, a third key experiment towards the development of this new SiC-YiG quantum sensor is presented here. It is the spin wave resonance (SWR) spectroscopy at X band of model permalloy ferromagnetic nanostripes. It is still performed with the same X band commercial cw/pulsed EPR spectrometer. permalloy nanostripes are investigated here because permalloy has no significant magnetocrystalline anisotropy just like the YIG ferrimagnetic material, and because they are much more easily accessible than YIG nanostripes at the moment, despite impressive recent progress in YIG nanomagnonics (see references cited in my theoretical work on the SiC-YIG quantum sensor [1]). This spin wave resonance study aims at checking the relevance of the theoretical design of the ferrimagnetic YIG nanostripe, in order to produce the required strong magnetic field gradient necessary to achieve sub-nanoscale spatial resolution by the sensitive ODPELDOR spectroscopy proposed with the SiC-YIG device, while avoiding the spectral overlap problem [15]. This spectral overlap problem, between the confined spin wave resonances existing in a ferro/ferri-magnetic nanostripe magnetized in plane along its width, and the shifted paramagnetic resonance investigated, can be avoided by a proper design of the nanostripe, as previously theoretically demonstrated in the context of quantum computing with SiC and permalloy nanostripe [15]. As the dipolar magnetic field produced by the ferro/ferri-magnetic nanostripe controls both the confinement of the edge spin waves inside the nanostripe and the shift of the external paramagnetic spins located above the nanostripe, the good correlation between the predicted and the measured spin wave resonance spectrum of a ferro/ferri-magnetic nanostripe is already a good indication of the validity of the predicted dipolar magnetic field gradient produced by the ferro/ferri-magnetic nanostripe. The outside dipolar magnetic field produced by a YIG or a permalloy nanostripe with exactly the same dimensions, having exactly the same spatial dependence but different intensities (due to the different saturation magnetization values of the two materials), the good correlation between experiment and theory found for the permalloy nanostripes here suggest that the predicted strength of the magnetic field gradient produced in the SiC-YIG nanodevice proposed should reach the value expected while allowing to avoid the spectral overlap.
Below I thus present successively, single fiber optical pumping assisted EPR and single fiber based ODMR experiments for the spectral characterization of the V2 spins in the bulk 4H-SiC sample investigated, then spin decoherence and spin relaxation time measurements to characterize the quantum coherent dynamics of the investigated bulk V2 spins and to confirm their high potential for quantum sensing application, then single fiber based optical pumping assisted PELDOR spectroscopy and quantum sensing of dark spins located nearby the bulk V2 spins, and finally a spin wave resonance study on model ferromagnetic nanostripes of permalloy.
2 Optical pumping assisted EPR and ODMR of V2 spins in bulk 4H-SiC using a single optical fiber
First, I demonstrate in Figure 1 that the Electron Paramagnetic Resonance (EPR) rotational pattern of the V2 color centers spins in bulk 4H-SiC can be recorded, under optical pumping conditions with this experimental setup, allowing to check the zero field splitting and g factor of those paramagnetic centers [3–7], and finally to identify them.
This rotational pattern was obtained here at X band and room temperature, using cw EPR under continuous optical pumping with a 785 nm laser. The optical pumping effect is clearly seen on the shape of the EPR spectrum of Figure 1: the left side positive signal correspond to an EPR transition with induced absorption, while the negative one on right side corresponds to stimulated emission associated to population inversion on this EPR transition. The rotational pattern of Figure 1 can be well reproduced (except the optical pumping effects) by anumerical simulation with Easyspin [16], as shown in Figure 2, considering a spin S = 3/2 with a zero field splitting D = 35 MHz and an isotropic g factor g = 2.0028, confirming previously obtained magnetic parameters of the V2 spin Hamiltonian in 4H-SiC [3–7].
Secondly, I demonstrate in Figure 3, that several EPR experiments on V2 color centers spins in bulk 4H-SiC and under continuous optical pumping are possible with this fiber based ODMR setup, that is, from top to bottom, room temperaturecw EPR, room temperature pulsed EPR, room temperature ODMR, and 90 K ODMR. The two first experiments benefits from the fact that a large ensemble of V2 spins is present in this 4H SiC HPSI sample allowing a direct detection of the EPR signal here, without any use of the photoluminescence, the optical fiber being however used for optical pumping of the V2 spins. However, the last two experiments presented in Figure 3 are true ODMR experiments, meaning that the photoluminescence of the V2 spin probes is the recorded signal along the vertical axis of those two ODMR experiments.
Note that the two ODMR spectrum of the V2 spins in 4H SiC presented here have been obtained under continuous optical pumping. To sensitively detect the ODMR spectrum, a train of periodic microwave pulses is send on the sample, such that instead of having a constant rate of photoluminescence under continuous optical excitation, one obtains a periodic modulation of the photoluminescence signal following the period of the microwave pulses, but only when a paramagnetic resonance of the V2 spins is excited by the microwaves.
Such paramagnetic resonance induces a change of spin state populations in the ground state, further converted in a change of the amount of photoluminescence collected under optical excitation. Such periodic photoluminescence signal is then collected by a photodiode and then send into a lock in amplifier allowing an efficient extraction of the amount of photoluminescence modulated at a frequency inversely proportional to the period between two successive microwave Pi pulses applied on V2 spins. Note that EPR nutation experiments, also called RABI oscillations measurements, were generally performed on V2 spins ensemble under optical pumping before such experiments, either using direct detection (not shown) or photoluminescence detection of the RABI oscillation as shown in Figure 4, in order to check the appropriate microwave Pi pulse parameters (choosing microwave power and pulse duration). Once the train of microwave Pi pulses resonant with the V2 spins has been adjusted, the ODMR measurement is easy to perform with the lock in amplifier.
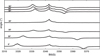 |
Fig. 1 CW EPR rotational pattern of the V2 spins in bulk HPSI 4H-SiC recorded at room temperature and at X band (f = 9.369 GHz) under continuous optical pumping, with a laser at 785 nm providing a power of P = 39 mW at the outpout of optical fiber. The nul angle corresponds to the external magnetic field aligned along the c axis of 4H-SiC. |
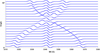 |
Fig. 2 Numerical simulation with Easyspin of the V2 rotational pattern in 4H-SiC, considering a spin S = 3/2 with a zero field splitting D = 35 MHz and an isotropic g factor g = 2.0028; f = 9.369 GHz; the linewidth is 3G here. The nul angle corresponds to the external magnetic field aligned along the c axis of 4H-SiC. Derivative of absorption curves are shown here. The spin state populations assumed here are those of the thermal equilibrium. |
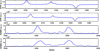 |
Fig. 3 From top to bottom and under continuous optical pumping at 785 nm: Room temperature cw EPR spectrum (f = 9.320 GHz, MS3, 36 mW at 785 nm), room temperature field sweep pulsed EPR spectrum (f = 9.308 GHz, MS3, 36 mW at 785 nm, recorded at 2 τ ≈ 2.4 μs), room temperature ODMR spectrum (f = 9.743 GHz, MD5, 36 mW at 785 nm), and 90 K ODMR spectrum (f = 9.746 GHz, MD5, 30 mW at 785 nm). The static magnetic field B0 is applied along the c axis of 4H-SiC. |
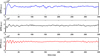 |
Fig. 4 ODMR detected coherent RABI oscillations of V2 spins in 4H SiC recorded at different microwave power attenuation (from top to bottom: 10 dB, 5 dB, 0 dB attenuation, MD5, B0 = 3457 G, f = 9.746 GHz), for various duration of the nutation microwave pulse applied (time). Periodically cycling this experiment, again allows obtaining a modulated amount of photoluminescence easily detected by a lock in amplifier. Those curves demonstrate the quantum coherent control of V2 spins by microwave pulses (nutation or single qubit quantum gate performed over a spin ensemble) and also their optical detection by photoluminescence, in a single ODMR nutation experiment. |
3 Spin decoherence and spin relaxation measurements of bulk V2 spins using pulsed EPR assisted by single fiber optical pumping
Thirdly, I demonstrate in Figure 5 that it is possible to measure, with this X band single optical fiber based OP-OD-MR setup, the spin coherence time T2, the longitudinal relaxation time T1 and the optical pumping time Top of the bulk V2 spins with appropriate experiments combining an optical pumping pulse and appropriately synchronized and time delayed microwave pulses. This is easy to implement with the hardware and software already available in a commercial E580 pulsed EPR spectrometer working at X band. The spectrometer provides several outputs on the PatternJet unit (pulse generator), one of which can be used to produce a TTL signal necessary for pulsing the laser. This has to be done in a synchronous manner with the microwave pulses, also produced by the PatternJet unit. The lenghts and delays between microwave and optical pulses are controlled by the XEPR software interface of the E580 spectrometer. At room temperature and with those optical pumping conditions,and using the standard inductive direct detection of the electron spin echo over the spin ensemble, I find Top = 139 μs, T1 = 354 μs, and T2 = 48 μs.
Those values of T1 and T2 are in good agreement with values reported for bulk V2 spins in 4HSiC at room temperature [3–7]. One note that it was also previously reported that the optical pumping time Top depends on the optical power send on the V2 spins [17] (and thus on the laser and coupler used) and on the temperature which controls T1. One can also note here that for using optimally the SiC-YIG quantum sensor which I described in my previoustheoretical work [1], a spin coherence time for an isolated sub-surface V2 spin probe of T2 = 12.5 μs was assumed. Thus, ODPELDOR spectroscopy should be feasible if the SiC surface defects can be made sufficiently silent, either by surface passivation or by cryogenic cooling of the whole quantum sensor, in order that the T2 of sub surface V2 has a value on the order of the one of bulk V2 spins found here.
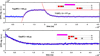 |
Fig. 5 Top curve: measurement of Top and T1 of bulk V2 spins in 4H-SiC at room temperature. A long optical pumping pulse of 1 ms at 785 nm and 36 mw optical power at the fiber output is used and has a fixed temporal position in the sequence. A standard direct detection spin echo sequence ( |


4 Dark spins quantum sensing by bulk V2 spins using single fiber based optical pumping assisted PELDOR spectroscopy
Another keyexperiment combining optical and EPR tools which is demonstrated here and which allows to go a step further towards fiber based ODPELDOR quantum sensing with a SiC-YIG quantum sensor, is optical pumping assisted PELDOR experiment, as shown in Figure 6. It is a pump-probe like two microwave frequencies experiment combined with optical pumping, as explained in my previous theoretical work [1]. It is conveniently implemented here by interfacing, through a single optical fiber, the capabilities of the commercial pulsed ELDOR spectrometer (ELEXYS E580) and the ones of the outside optical setup. The two PELDOR experiments presented here are four-pulse DEER (double electron electron resonance) experiments [2] combined, either with a continuous optical pumping and direct EPR detection of the stimulated echo (top spectrum), or with a transient optical pumping pulse and a direct detection of the refocused echo (bottom spectrum). When the pump frequency fp is resonant with any spin specy present in the sample and physically close to the V2 spins probe, then a driven decoherence effect occurs producing a reduced spin echo of the V2 spins probes, and thus a dip in the PELDOR spectrum. As the stimulated echo has a larger amplitude than the refocused echo, the PELDOR spectrum on the top of Figure 6 has a better signal to noise ratio than the one on the bottom of Figure 6 using the refocused echo, which is generally used in structural biology [2]. The comparison also shows that continuous optical pumping seems not to induce a decrease of the signal to noise ratio of such PELDOR experiment.
The two obtained PELDOR spectrum correspond to the one expected. The preparatory experiment was the field sweep pulsed EPR spectrum of Figure 3, thus the PELDOR spectrum (versus fp) should reflect somehow this field sweep spectrum (versus B0), but with of course an inverted order of the resonance lines. Of course, when fp = fs = 9.308 GHz, the V2 spins feel an accelerated driven decoherence due to themselves, such that the probing EPR line chosen is always seen in such a PEDLOR spectrum versus fp. However, one can also distinguished on both PELDOR spectrum another dip occurring at fp = 9.243 GHz. This resonance line is 65 MHz below fs, corresponding to a resonance line 23.2 G above the low field EPR line of the V2 shown on the field sweep pulsed EPR spectrum of Figure 3. This line was thus also present on the pulsed EPR field sweep spectrum of Figure 3 and correspond to other kinds of intrinsic defects in 4H-SiC having a g factor also very close to the one of the V2, that is close to g = 2.0028. Thisline is often attributed to carbon related defects in bulk 4H-SiC. That means that the dip seen at fp = 9.243 GHz corresponds to the additional decoherence effect felt by the V2 spins probes due to the microwave driven manipulation of the carbon related defects located nearby them, producing through dipolar couplings, a fluctuating local magnetic field on the sites of the V2 spins probes. This is exactly the principle at the heart of quantum sensing as explained in my previous theoretical work on the SiC YIG quantum sensor [1]. The main difference is that here the target spin bath is 3D, whereas in ODPELDOR spectroscopy, applied for example to structural biology, the target spin bath is 2D. Here also, direct detection is used due to the large amount of bulk V2 spins available, instead of the highly sensitive photoluminescence detection required for the single V2 spin detection.
As a last remark, one notes that the third EPR line seen on the field sweep pulsed EPR spectrum of Figure 3 is not seen here in the PELDOR spectrum. The reason is assumed to be the limited bandwidth available in the presented PELDOR experiments performed with a standard MS3 flexline resonator from Bruker. The MS3 cavity is known to have a bandwidth at half maximum of its microwave reflexion curve nearly equal to 100 MHz. As the central frequency of the cavity is here set equal to the resonant frequency of the V2 spins probes at fs = 9.308 GHz under B0 = 3297 G, then any other resonant EPR line located much beyond +/- 50 MHz from fs = 9.308 GHz cannot be observed in the PELDOR spectrum by lack of microwave power at the associated pump frequency entering the cavity at those frequencies (the microwave power is reflected). The high field EPR line of the V2 spins occurs at B0 = 3345 G as shown on the field sweep pulsed EPR spectrum of Figure 3 and should thus appears at 9243-65 = 9178 MHz, which is thus not possible here. Those two room temperature optical pumping assisted PELDOR experiments thus: (i) clearly showthat V2 spins probes, which are photoluminescent and which can thus be optically detected in an ultra sensitive manner by ODMR, can sense by microwave driven decoherence effects some paramagnetic centers located nearby them which are themselves not photoluminescent, thus providing a way to considerably increase the sensitivity of standard pulsed EPR spectrometers if the proposed SiC-YIG quantum sensor can be fabricated; (ii) they also demonstrate that using one single V2 EPR line and targeting a spin label, a paramagnetic molecule, or a spin qubit EPR line located nearby the V2 EPR line, it should be clearly possible to perform ODPELDOR spectroscopy applied to structural biology, surface chemistry, or to quantum computing/simulation with the SiC-YIG quantum sensor I previously proposed [1].
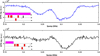 |
Fig. 6 PELDOR experiments of the type four-pulse DEER experiments combined, either with a continuous optical pumping and direct EPR detection of the stimulated echo (top spectrum), or with a transient optical pumping pulse and a direct detection of the refocused echo (bottom spectrum).B0 is parallel to the c axis of 4H-SiC. In both PELDOR experiments, B0 = 3297 G, T = 300 K, and the probe microwave frequency is fs = 9.308 GHz, such that the low field EPR line of the V2 spins seen in Figure 3 is here resonantly excited at fs. The microwave pump frequency fp is varied in the range [9.15; 9.4] GHz, thus over 250 MHz, in 250 steps of 1 MHz. Inset: pulses sequences applied: pink: optical pumping (first arrow); red: microwave pulse at fs (second arrow) and fp (third arrow); dark: the spin echo used for direct detection, i.e. the one integrated. |
5 Spin wave resonance experiments on model ferromagnetic nanostripes of permalloy to test the nanostripe design
Finally, I present in this section some test spin wave resonance experiments, performed not on YIG nanostripes at X band, but on the more easily accessible permalloy nanostripes at Q band (34 GHz). Those experiments were numerically simulated following the theoretical approach I previously presented in the context of quantum computing with an array of spin qubits in SiC located nearby a permalloy ferromagnetic nanostripe [15].
For the numerical simulation, I used the saturation magnetization (11700 G) and g factor (2.00) known for permalloy and the dimension of the Py nanostripes (thickness T = 100 nm, width w = 300 nm, and length L = 100 μm). As it can beseen in Figure 7, the experimentally observed spin wave resonance spectrum and the theoretical one match quite well, the six main spin wave resonance being obtained and having resonant magnetic fields close to the experimental ones, with an error on the order of one or few spin wave resonance linewidth. This is quite satisfactory considering the fact that there are nofree parameter in the theoretical simulation presented here. As already discussed in the introduction, the good correlation between SWR experiments and theory found here for the permalloy nanostripes, suggest that the predicted strength of the magnetic field gradient produced in the SiC-YIG nanodevice proposed should reach the large value expected, while allowing to avoid the spectral overlap problem [15] between the YIG SWR and the shifted paramagnetic resonances.
 |
Fig. 7 Spin wave resonance (SWR) spectrum of an ensemble of permalloy ferromagnetic nanostripes (thickness T = 100 nm, width w = 300 nm, and length L = 100 μm): bottom curve in red: derivative spectrum, as measured at Q band (f = 34 GHz) with a magnetic field applied in the plane of the nanostripes, along the width w; top curve inblue: absorption spectrum, as numerically simulated without any free parameter (and without considering the differentoscillator strengths of the various SWR). |
6 Conclusion
In this article, I have presented my first experiments towards the development of a new SiC-YiG hybrid quantum sensor compatible with a standard X band pulsed EPR spectrometer widely used worldwide. My successful optically detected magnetic resonance experiments, as well as my dark spin quantum sensing experiments performed with bulk V2 spins and using optical pumping assisted PELDOR experiments, confirm the relevance of this new experimental approach towards state of art dark spins quantum sensing, interfacing a standard photoluminescence setup with a standard pulsed EPR/ELDOR spectrometer by means of a single optical fiber. The good correlation between predicted and measured spin wave resonance in permalloy model nanostripes also confirm the relevance of the nanostripe design. This new experimental approach for state for art dark spins quantum sensing and the related SiC-YIG quantum sensor should thus be of great interest for all the biophysicists, chemists and physicists, which are already worldwide pulsed EPR user and which are interested to upgrade their spectrometer up to single dark spin sensitivity and up to nanoscale resolution, for various applications. The next challenges towards the practical demonstration of such a new approach for state of art quantum sensing are thus now mainly lying in materials micro/nano-engineering. Some next steps of this experimental project are thus: (i) the fabrication by ion implantation of sub-surface quantum coherent isolated V2 spin probes, (ii) the fabrication of 4H-SiC nanophotonic structures for the efficient excitation and collection of few/one V2 spin probe/s photoluminescence by a single optical fiber, and (iii) the fabrication of appropriate YIG nanomagnonic structures for the investigation of the depth profile of sub surface V2 color center spins created by ion implantation. The impressive ongoing technological progress in SiC nanophotonics and in YIG nanomagnonics will clearly help the rapid development of this new SiC-YiG quantum sensor and its applications.
Acknowledgements
The author thanks the University of Strasbourg and CNRS for the recurrent research fundings. The author also thanks the STNano central of technology in Strasbourg for fabricating and providing the model permalloy nanostripes studied here.
References
- J. Tribollet, Eur. Phys. J. Appl. Phys. 90, 20102 (2020) [CrossRef] [EDP Sciences] [Google Scholar]
- A. Schweiger, et al., Principles of pulse electron paramagnetic resonance (Oxford University Press, Oxford, UK, 2001) [Google Scholar]
- H. Kraus et al., Sci. Rep. 4, 5303 (2014) [CrossRef] [PubMed] [Google Scholar]
- M. Widmann et al., Nat. Mater. 14, 164 (2015) [CrossRef] [PubMed] [Google Scholar]
- P.G. Baranov et al., Mater. Sci. Forum 740, 425 (2013) [CrossRef] [Google Scholar]
- F. Fuchs, Ph.D. thesis, Wurzburg University, 2017 [Google Scholar]
- S.A. Tarasenko et al., Phys. Status Solidi B 255, 1700258 (2018) [CrossRef] [Google Scholar]
- S. Castelleto et al., J. Phys. Photonics 2, 022001 (2020) [CrossRef] [Google Scholar]
- N.T. Son et al., Phys. Rev. B 68, 205211 (2003) [Google Scholar]
- N.T. Son et al., Phys. Rev. B 83, 125203 (2011) [Google Scholar]
- J.S. Embley et al., Phys. Rev. B 95, 45206 (2017) [Google Scholar]
- D.J. Christle et al., Nat. Mater. 14, 160 (2015) [CrossRef] [PubMed] [Google Scholar]
- R. Nagy et al., Nat. Commun. 10, 1954 (2019) [PubMed] [Google Scholar]
- G. Janssen et al., Rev. Sci. Instrum. 72, 4295 (2001) [Google Scholar]
- J. Tribollet, Eur. Phys. J. B. 87, 183 (2014) [Google Scholar]
- S. Stoll et al., J. Magn. Reson. 178, 42 (2006) [Google Scholar]
- M. Fischer et al., Phys. Rev. Appl. 9, 54006 (2018) [Google Scholar]
Cite this article as: Jérôme Tribollet, Hybrid nanophotonic-nanomagnonic SiC-YiG quantum sensor: II/Dark spins quantum sensing with V2 spins and fiber based OP-PELDOR/ODMR., Eur. Phys. J. Appl. Phys. 90, 20103 (2020)
All Figures
|
Fig. 1 CW EPR rotational pattern of the V2 spins in bulk HPSI 4H-SiC recorded at room temperature and at X band (f = 9.369 GHz) under continuous optical pumping, with a laser at 785 nm providing a power of P = 39 mW at the outpout of optical fiber. The nul angle corresponds to the external magnetic field aligned along the c axis of 4H-SiC. |
| In the text | |
|
Fig. 2 Numerical simulation with Easyspin of the V2 rotational pattern in 4H-SiC, considering a spin S = 3/2 with a zero field splitting D = 35 MHz and an isotropic g factor g = 2.0028; f = 9.369 GHz; the linewidth is 3G here. The nul angle corresponds to the external magnetic field aligned along the c axis of 4H-SiC. Derivative of absorption curves are shown here. The spin state populations assumed here are those of the thermal equilibrium. |
| In the text | |
|
Fig. 3 From top to bottom and under continuous optical pumping at 785 nm: Room temperature cw EPR spectrum (f = 9.320 GHz, MS3, 36 mW at 785 nm), room temperature field sweep pulsed EPR spectrum (f = 9.308 GHz, MS3, 36 mW at 785 nm, recorded at 2 τ ≈ 2.4 μs), room temperature ODMR spectrum (f = 9.743 GHz, MD5, 36 mW at 785 nm), and 90 K ODMR spectrum (f = 9.746 GHz, MD5, 30 mW at 785 nm). The static magnetic field B0 is applied along the c axis of 4H-SiC. |
| In the text | |
|
Fig. 4 ODMR detected coherent RABI oscillations of V2 spins in 4H SiC recorded at different microwave power attenuation (from top to bottom: 10 dB, 5 dB, 0 dB attenuation, MD5, B0 = 3457 G, f = 9.746 GHz), for various duration of the nutation microwave pulse applied (time). Periodically cycling this experiment, again allows obtaining a modulated amount of photoluminescence easily detected by a lock in amplifier. Those curves demonstrate the quantum coherent control of V2 spins by microwave pulses (nutation or single qubit quantum gate performed over a spin ensemble) and also their optical detection by photoluminescence, in a single ODMR nutation experiment. |
| In the text | |
|
Fig. 5 Top curve: measurement of Top and T1 of bulk V2 spins in 4H-SiC at room temperature. A long optical pumping pulse of 1 ms at 785 nm and 36 mw optical power at the fiber output is used and has a fixed temporal position in the sequence. A standard direct detection spin echo sequence ( |
| In the text | |
|
Fig. 6 PELDOR experiments of the type four-pulse DEER experiments combined, either with a continuous optical pumping and direct EPR detection of the stimulated echo (top spectrum), or with a transient optical pumping pulse and a direct detection of the refocused echo (bottom spectrum).B0 is parallel to the c axis of 4H-SiC. In both PELDOR experiments, B0 = 3297 G, T = 300 K, and the probe microwave frequency is fs = 9.308 GHz, such that the low field EPR line of the V2 spins seen in Figure 3 is here resonantly excited at fs. The microwave pump frequency fp is varied in the range [9.15; 9.4] GHz, thus over 250 MHz, in 250 steps of 1 MHz. Inset: pulses sequences applied: pink: optical pumping (first arrow); red: microwave pulse at fs (second arrow) and fp (third arrow); dark: the spin echo used for direct detection, i.e. the one integrated. |
| In the text | |
|
Fig. 7 Spin wave resonance (SWR) spectrum of an ensemble of permalloy ferromagnetic nanostripes (thickness T = 100 nm, width w = 300 nm, and length L = 100 μm): bottom curve in red: derivative spectrum, as measured at Q band (f = 34 GHz) with a magnetic field applied in the plane of the nanostripes, along the width w; top curve inblue: absorption spectrum, as numerically simulated without any free parameter (and without considering the differentoscillator strengths of the various SWR). |
| In the text | |
Current usage metrics show cumulative count of Article Views (full-text article views including HTML views, PDF and ePub downloads, according to the available data) and Abstracts Views on Vision4Press platform.
Data correspond to usage on the plateform after 2015. The current usage metrics is available 48-96 hours after online publication and is updated daily on week days.
Initial download of the metrics may take a while.